Recently, with the development of the Internet, all kinds of applications sharply increased. However, not all of them were evenly welcomed by customers. Some good apps were downloaded over a billion times, on the other hand, some apps only have several download times. Someone might think this is due to the trend of society. Is this true? What potential factors influence the result as well?
Google Play, as an official app store, provides the users millions of latest apps. It is necessary for the application developer to understand the preference of users in order to improve current apps and develop new apps which are more competitive than its competitors.
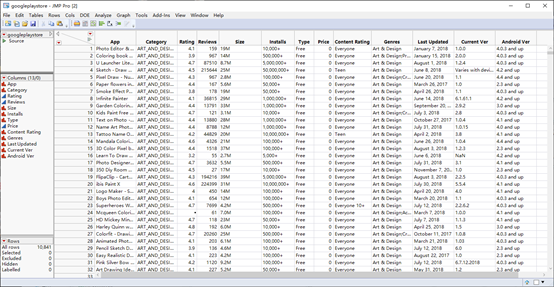
The datasets provide the application’s names, ratings, reviews, types, prices and install times. With those data, we could figure out the invisible facts which affect the customers’ behavior.
With those concerns, our group chooses the following questions to analyze.
What’s the most popular (installs ) app categories? Are them have the highest rating too?
What kinds of apps are more likely to be given review? And what factors would affect the review of users?
If an early version would let the application have much more installs.
Will a long name of an app decrease the install times? Could we give some advice to app developers when they are naming their apps?
The customers are much more likely to pay for which kind of apps? What are the recommended ranges of the price?
Is there any relationship between rating and last updated?
From those questions, we want to find some key facts which might be helpful to app developers. So that they could develop better applications for customers to download and reduce the aimless time if they are planning to build a new program.
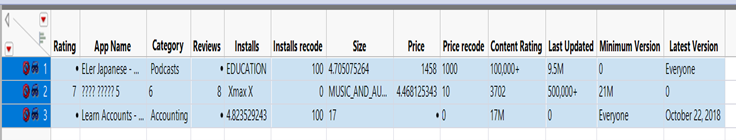
Figure 1: Overview of dataset
Data Preparation
Modify Data Type
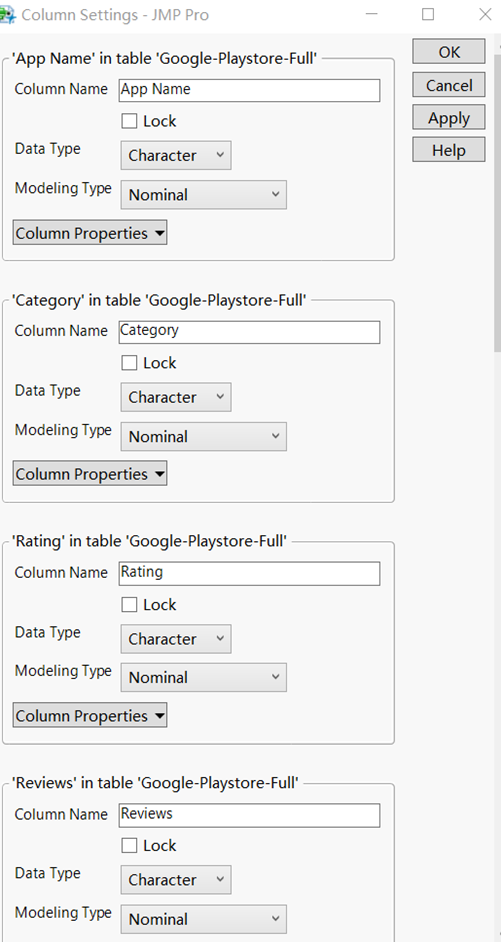
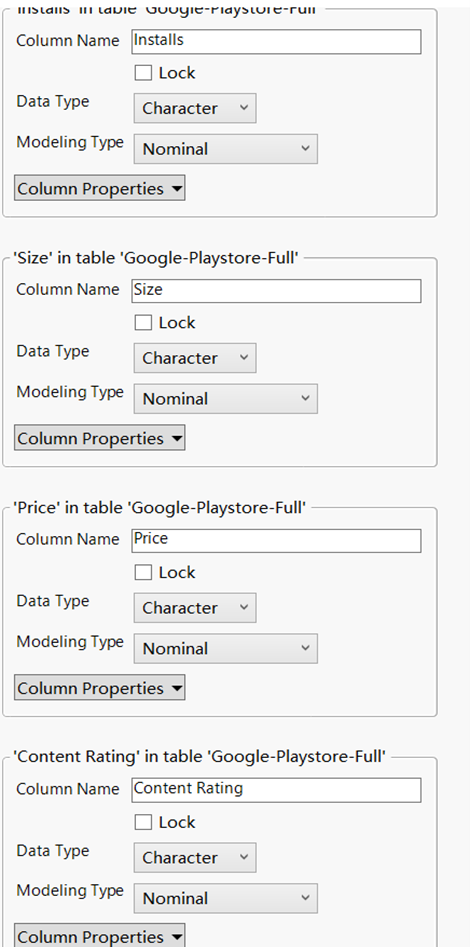
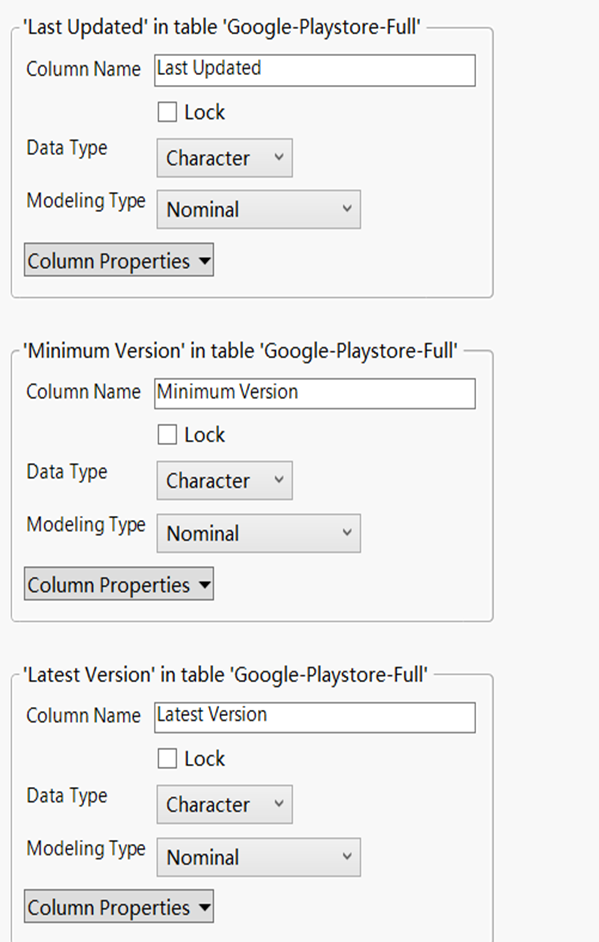
Figure2: Unchanged column information overview
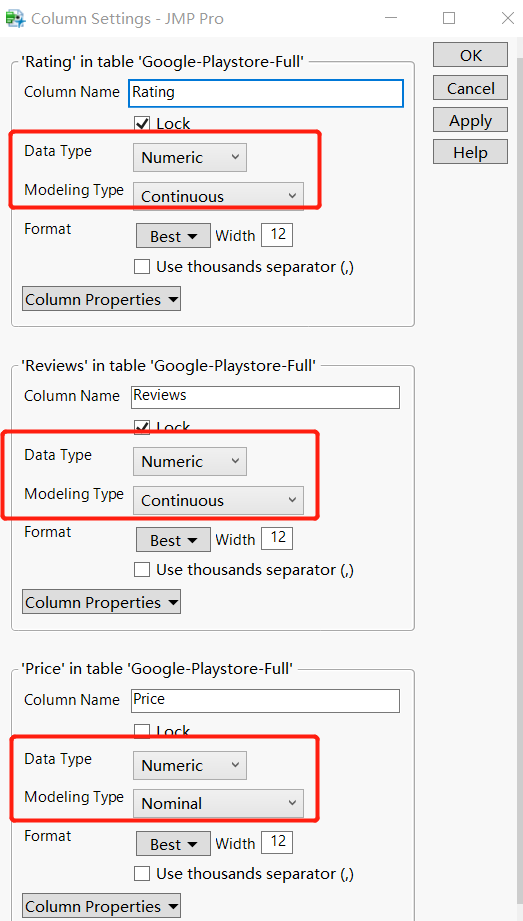
In the original dataset ‘Rating’, ’Reviews’, ’Price’ data type is ‘Character’ which is not correct. Here we change those variables type to ‘Numerical’ the result are shown below.
Figure3: Modified column
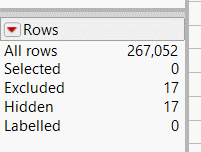
Variable Hide and Exclude
‘Category’ column clean
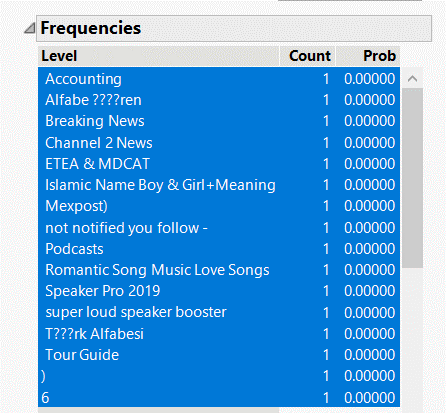
Figure4: ‘Category’ distribution
In the ‘Category’ column there have some type of games only have one and total number of them are just 17. They are of little significance in our research so are hided and excluded from our dataset.
’App Name’ column clean
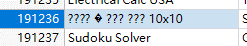
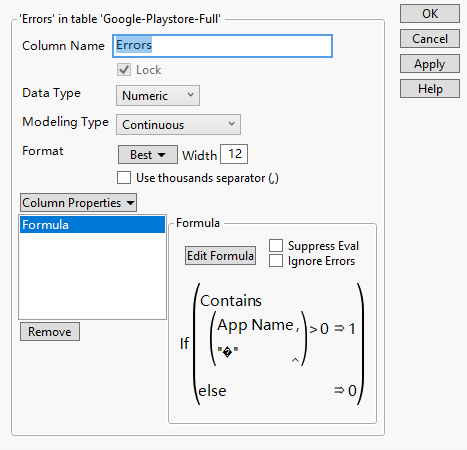
In the dataset, we could find quite a number of rows which apps’ name are “?” or contain “�”.
Figure5: Missing or mis-reading values
Those error values are caused by missing or mis-reading values by JMP. We use formular function to find those values. And then, select where the column’s value is 1 and exclude them from our dataset.
Figure6: Replacing the “�” by “?” could find the missing value and exclude them in the same way.
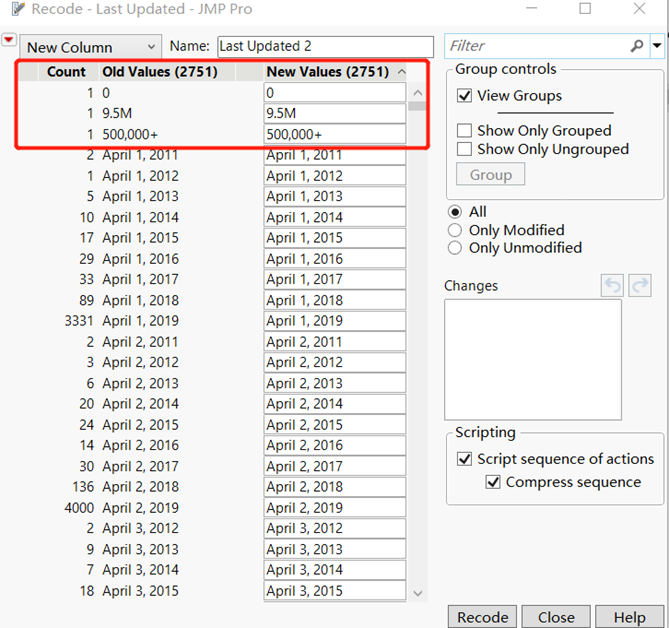
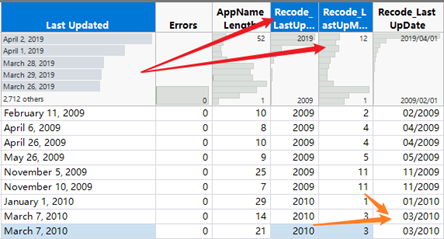
‘Last Updated’ column clean
In the ‘Last Updated’ column, there have three rows content are not date format and have no sociation with date. For more accurate research that enroll ‘Last Updated’ column, those three rows are exclude from original dataset.
Figure7: ‘Last Update’ column overview
Analysis Procedures
What kinds of apps are more likely to be given review? And what factors would affect the review of users?
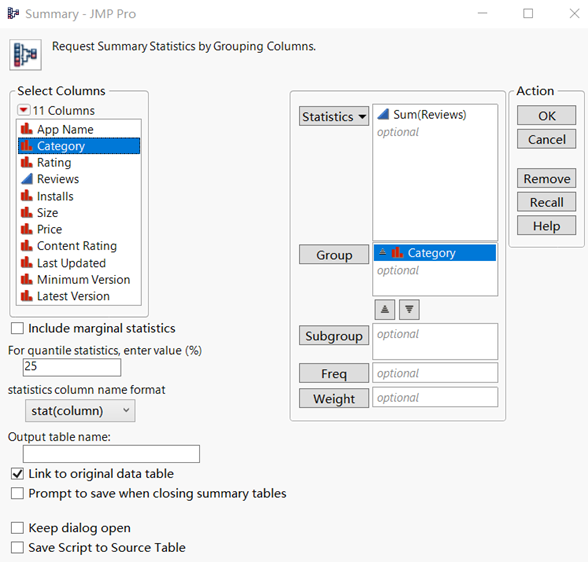
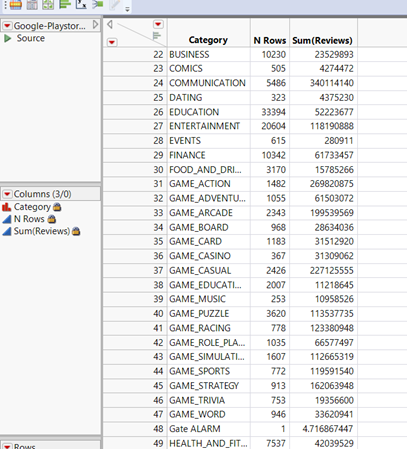
In order to clearly show how many reviews there are in each category of games, we need to create a new data table. Use the summary function and select the ‘Category’ variable in the Group, and select ‘Reviews’ in the data that needs statistics.
Figure9: ‘Category Rows’, ‘Sum(Reviews) , ‘N Rows’
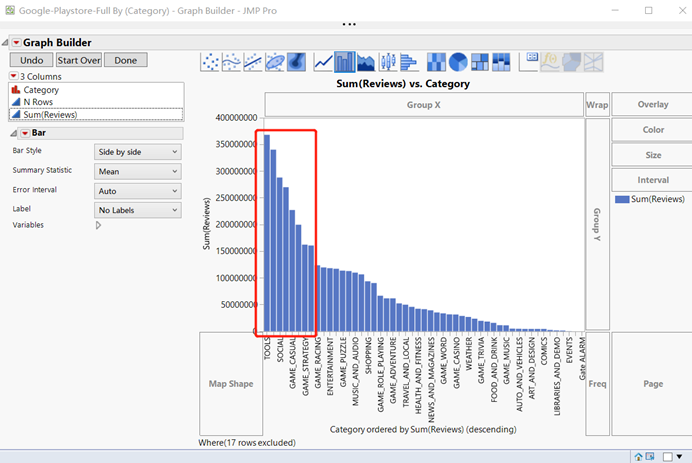
Figure10: bar chart of the ‘Sum (Reviews) vs Category’
Use the Graph function in the new data table to create a bar chart that can compare the number of different types of games more intuitively, and sort them in descending order to select the most eight types of games.
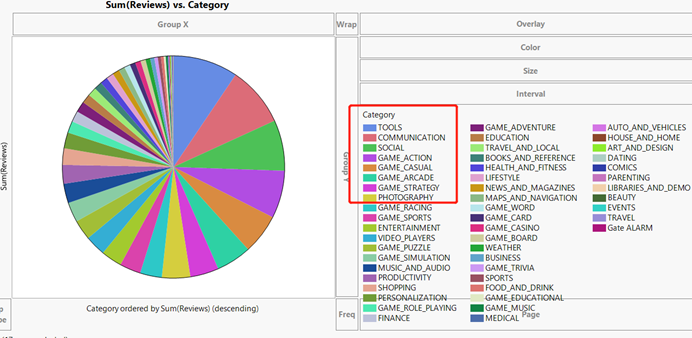
Since the bar chart cannot clearly display the name of the game category in each column, a Pie chart is created here to display the names of the top 8 game categories. Considering the Pie chart and bar chart, you can easily discover the game that have most reviews in the Google game market.
Fgirue11: pie chart of the ‘Sum (Reviews) vs Category’
From figure 10, we can find that the 8 games that have most reviews are ‘TOOLS’, ‘COMMUNICATION’,’SOCIAL’, ‘GAME_ACTION’, ‘GAME_CASUAL’, ’GAME_ARCADE’, ‘GAME_STRATEGY’ and ‘PHOTOGRAPHY’.
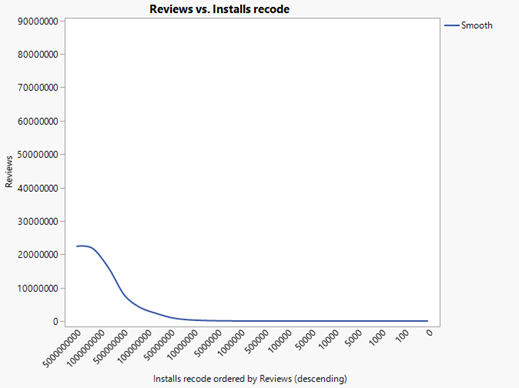
Figure12: Smoother chart of ‘Reviews vs recode Installs’
Figure13: Smoother chart of ‘Category vs Installs recode’, ‘Installs recode’ is numeric continuous variable.
By analyzing the relationship between the number of installations and the number of reviews of different games, we can find that the more installations, the more the number of reviews of the game. At the same time, the 8 categories with the most installations also have the most reviews as shown in figure 11 and figure 12.
Will a long name of an app decrease the install times? Could we give some advice to app developers when they are naming their apps?
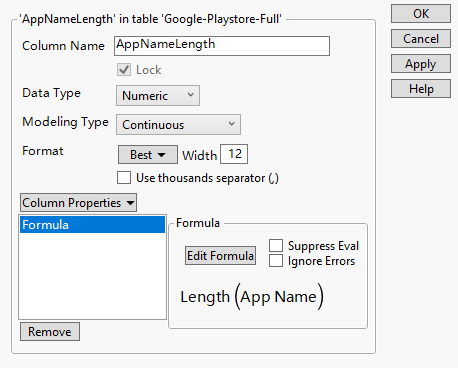
First, we add a new column and apply formular to call “Length” function to calculate the length of the applications. The column info is shown in the following picture.
Figure14:’AppNameLength’
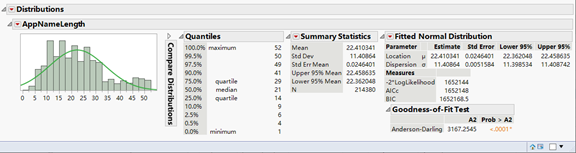
Take a look at the AppName Length distribution.
Figure15: AppName Length distribution
Although tens of thousands of developers named their applications differently and randomly, based on our test, the distribution of the AppName Length is not normal distribution. The p-value is less than 0.05 and we reject the null hypothesis which the distribution is normal. The length of applications’ name mainly concentrate on 10~28 letters.
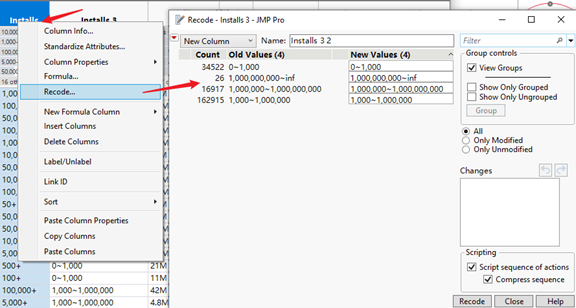
In order to simplify the analysis, we modify the app install times into four level, “0~1,000 times”, “1,000~1,000,000 times”, “1,000,000~1,000,000,000 times”, “over 1,000,000,000 times”. This change could be realized by recode function.
Figure16: ‘Installation’ column Recode
Now we could use “Fit X by Y” function and put install times as x factor and the length of applications’ name as y response, then click OK to run.
The result is oneway analysis. We click red triangle and turn on “Means/Anova” and “Compare means” -> “All Pairs, Tukeys HSD” to see if there has difference in AppNameLength between different install times application.
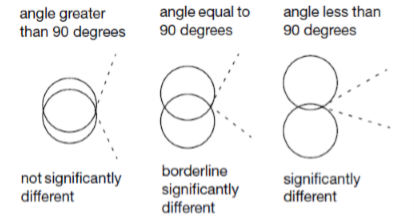
In the dot plot image on the right, you can click on the individual circles to compare the relationship between them. These circles are a graphical way to test the average level of each predictor variable. You can visually compare the averages of each group by seeing how the comparison circles intersect. The intersecting outer angles indicate whether the group averages are significantly different (see figure below).
Figure 17:Circle intersect
Obviously different average circles do not intersect or intersect slightly, so the outer angle of intersection is less than 90 degrees. If the circles intersect or nest at an angle greater than 90 degrees, there will be no significant difference in the average.
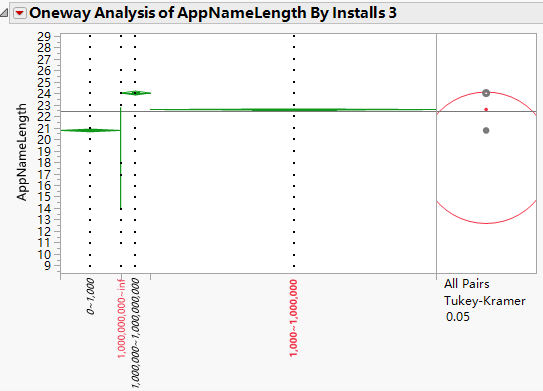
From the following picture we could draw conclusion that there has difference between “0~1,000”, “1,000~1,000,000” and “1,000,000~1,000,000,000”. However, those 3 groups’ means are not significantly different with “over 1,000,000,000”. For those installation times over 1 billion times apps, the length of their name actually is no longer the fact that infects their downloading. Those applications are Gmail, Google, YouTube, WhatsApp Messenger, etc. Thus, the length of those apps’ means are not significantly different with others.
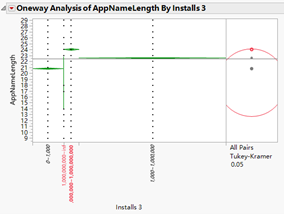
Figure18: Oneway Analysis of AppNameLength By Installs 3
The applications which installation times less than 1 thousand, their names’ length are around 18 letters. The applications which installation times between 1 thousand and 1 million, their names’ length are around 17 letters. The applications which installation times between 1 million and 1 billion, their names’ length are around 23 letters.
This fact might be caused by the information which contains in the app’s name. Compared with 18 letters, 23 letters could use 1 or 2 words more to describe its app. Thus, the users would more likely be attracted and download the application.
Figure19: AppNameLength&Installs
Is there any relationship between rating and last updated?
In order to find the relationship between rating and the time which the application last updated, we need the information about rating and time. The rating is given in the dataset, however, although the Last Updated time is given as well, its records are in character type which could not simply change to numeric type.
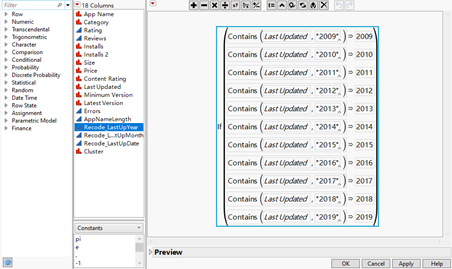
We build new columns and use formula function to extract time information out of ‘Last Updated’ column like the following pictures show.
Figure20: Last Updated
Figure21: ‘Recode_Last Up Year’ formula
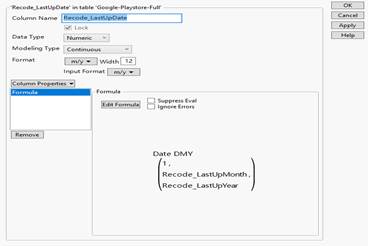
After extracting the month and year information, then we could use time formula to combine that 2 information to new Last Updated column which is in numeric type.
Figure 22: ‘Recode_LastUpDate’ column information
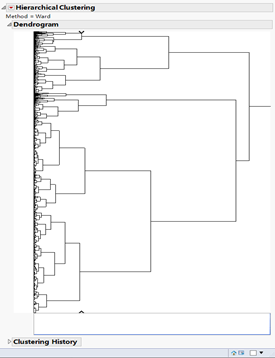
The Date DMY formula actually will return the seconds since 1.1.1970. We also need to modify it into the normal time type by change column info. Now we could use Analyze→clustering→hierarchical cluster function and put those 2 columns in it and calculate. It takes few minutes to run the result.
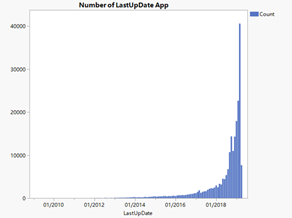
Figure23: Hierarchical Clustering & apps number with last up date
The left above picture is the result of hierarchical cluster. We choose 9 clusters and save the cluster result to the data table and plot it by graph builder function. The result is like the following pictures.
From the right above picture we could see that with the time passing by, more and more applications were put onto the google play. Before 2018, there were only 3000 apps. However, after 2018, the number of applications in google play turn out to be exponential growth. This result is consistent with the scatter plot.
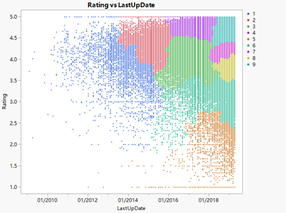
We apply Rating in y axis and use the previous saved cluster data to be color. The result is like the following pictures.
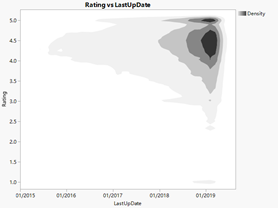
From the left image, we could see there mainly are two concentrate parts. The first part is where rating is 5 marks. It is easy to understand this result in real world. When people are asked to rate, some of them are quite bother and just give 5 marks to save time.
Figure24: Graph with ‘Rating’ and ‘LastUpDate’
However, from the graph we could find that there is not obvious relationship between the time of update and ranking. Although from the right picture we could see there are many clusters, the clusters also increase with the number of applications. Thus, we could not draw conclusion that the app’s last update time have relationship with ranking.
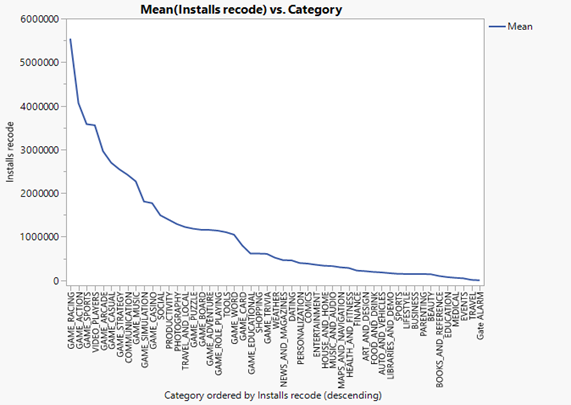
What’s the most popular (installs) app categories? Are them have the highest rating too?
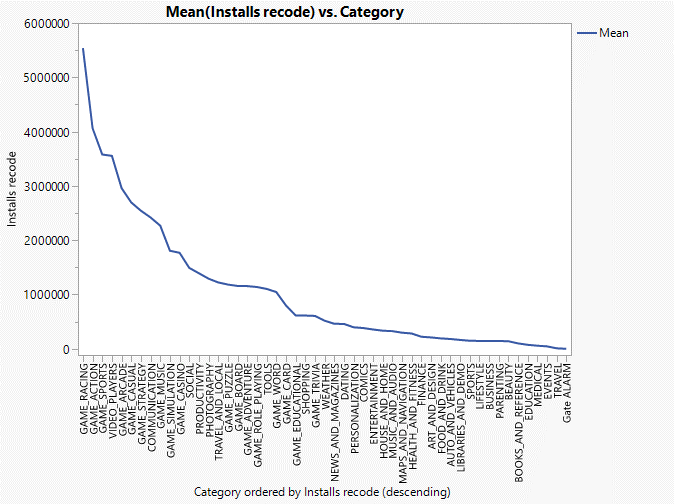
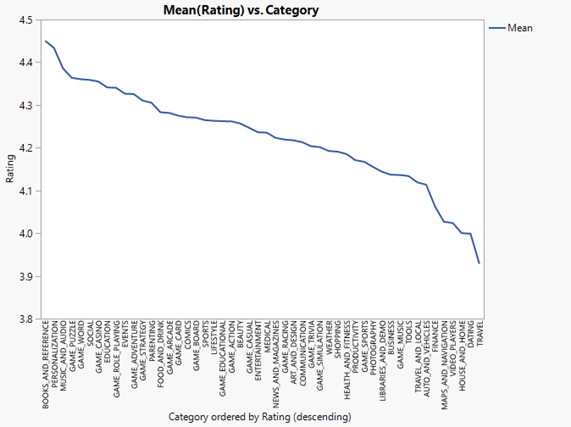
Figure25: ‘Category vs Mean(Installs recode)’ and ‘Category vs Mean(Rating)
From the figure25, the 6 categories have most rating is ‘BOOKS_AND_REFERENCE’,’EVENTS’,‘MUSIC_AND_AUDIO’, ’PERSONALIZATION’, ‘SOCIAL’, ’GAME_PUZZLE’ and 6 categories have most installations are ‘GAME_RACING’, ‘GAME_ACTION’, ‘GAME_SPORTS’, ‘VIDEO_PLAYERS’, ‘GAME_ARCADE’, ‘GAME_STRATEGY’.
We will find that the 6 types of games with the highest user ratings are not the same as the 6 types of games with the most installs. We can use game installs as a measure of the popularity of the game. Through figure25, we can find that the six most popular category games are not the six highest rating games, which means that the popularity of the game does not depend on the user rating.
Conclusion
By analyzing the download volume of different games in the Google App Store and the characteristics of the game itself. We have found some suggestions that can help game developers increase future installations/sales of games during the game development phase.
For example, game developers do not need to care too much about the opinions of players during the game development stage. Game developers should listen to their inner voices to make games instead of completely following the public’s ideas, because even the games that are highly rated in the Google Play Store, the final download volume is not very high. While those games with a high installation volume have low ratings among players, they are loved by more people because of their unique game experience and design ideas.
In this way, you can develop games that are more popular in the market while investing the same amount of time and cost.
Although there is no apparent relationship between applications’ update time and ranking, we find the app has sharply increased since 2018. The average level of feedback mark is around 4.5. And we see the difference between download times and the length of the application’s name. Our research suggests that using approximately 23 letters to name applications could have more install times because it could give users more information.